I started to dream when I was at Grey in the Mad Men era, fresh out of college. I imagined that I could be the one to first discover the EEG signature in the brain when an ad caused persuasion. With Norm Hecht as my mentor and collaborator we called it the Coefficient of Communication.
Of course, Wharton Neuroscience beat us to the punch, discovering that Synchrony is the EEG brain signature most predictive of incremental branding and sales effects. They just figured that out in the past couple of years, working with blue chip advertisers. I’m of course thrilled that Wharton, in the course of its uniquely large sample neuro study sponsored by FOX, determined that the closest predictor of sales behind Synchrony is the RMT Resonance method which Howard Shimmel and I invented in 2017.
In 2005 I co-founded TRA, the first company to link ad exposure to purchase on millions of households. TRA started in TV and then with Comscore and Datalogix added digital as well. We had always-on matches with purchases for every UPC code product sold in US supermarkets, auto registrations, prescription drugs, and first party data. You could run an optimization against any target you wanted, and once the campaign went on air you could track its sales results. Mars found they could pull ads off quickly that were not selling and this lifted their ROAS +52%. Many of the 77 CPG brand direct clients targeted Heavy Swing Purchasers (heavy category buyers who bought your brand but not loyally) because this lifted ROAS an average of +28%.
At TRA I wanted us to be able to also measure branding metrics, and we actually could do that through the TiVo subpanel within our footprint. One reason I wanted to be able to measure branding metrics is to be able to see the gradual effects of advertising before the consummation of the incremental purchase.
When MTA came along, I really wanted to do MTA with branding as well as sales effects, because that way you could see which impressions moved the needle, rather than have to guess the value of the last impression before the incremental purchase versus each of the other impressions. I had already sold TRA to TiVo by 2014 but was still consulting for what was at the time called TiVo Research when I created this slide:

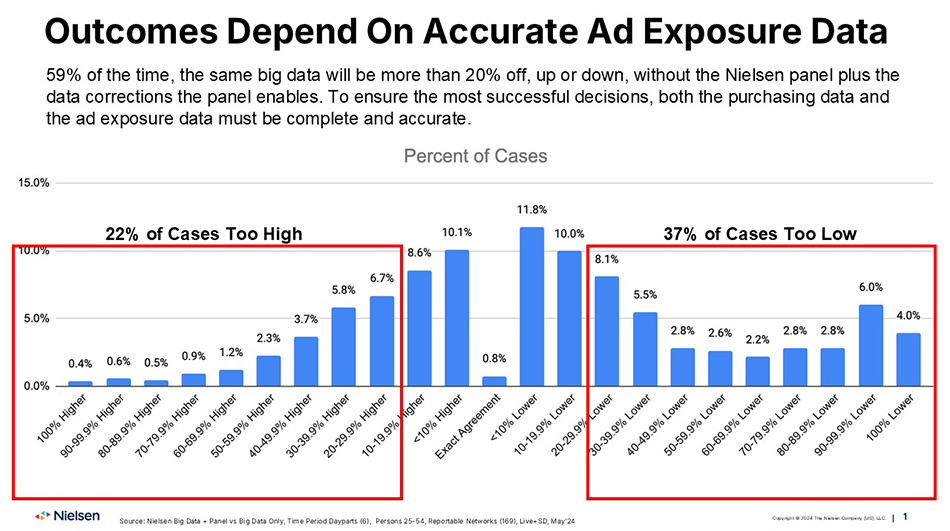
At TRA we were quite proud of the 3.4 million household sample we had, and of using two ID graphs for greater accuracy of matching impressions and purchases. How far has the industry progressed beyond our pioneer work? Nielsen now has its 45,000 home panel plus 75,000,000 devices plus 135,000,000 people in its national respondent-level database. It now has in the U.S. full census deterministic advanced audiences covering CPG purchasers for over 100,000,000 individual people, 100% coverage of auto registration data, 80% of credit card transactions, and uses nearly ten of the best ID graphs together. The measurement industry has come so very far in ten short years.
And there’s still great work to be done!
Posted at MediaVillage through the Thought Leadership self-publishing platform.
Click the social buttons to share this story with colleagues and friends.
The opinions expressed here are the author's views and do not necessarily represent the views of


