Ten Benefits of Leveraging Data Visualization for Enhanced Decision-Making and Revenue Optimization in Local Broadcasting
Local broadcasters face unprecedented challenges in today's media landscape, characterized by rapidly evolving consumer preferences, technological advancements, and intense competition. To thrive, broadcasters must effectively use diverse and complex data to inform their decisions and strategies. With the advent of data analytics and visualization technologies, broadcasters have powerful tools at their disposal, translating complex data into actionable insights for more informed decision-making, enhanced content delivery, and maximized revenue opportunities.
By integrating various business metrics and key performance indicators into visually compelling dashboards, broadcasters can:
- Gain insights into viewership patterns, audience demographics, and content performance
- Tailor their offerings to meet audience demands
- Optimize programming schedules and advertising revenues
- Allocate resources effectively
The process of transforming raw data such as audience reach, engagement rate, viewership trends, ad revenue, cost per acquisition, social media mentions, demographic insights, content performance, ad performance, and competitive analysis into visual dashboards is a game-changer. It helps broadcasters easily identify trends, patterns, and outliers, allowing for a quick grasp of key insights and real-time decision-making.
By visualizing ad revenue, cost per acquisition, and ad performance metrics, broadcasters can optimize ad placement, pricing, and targeting strategies to maximize profitability. Additionally, competitive analysis enables them to benchmark their performance against competitors and identify opportunities for revenue growth.
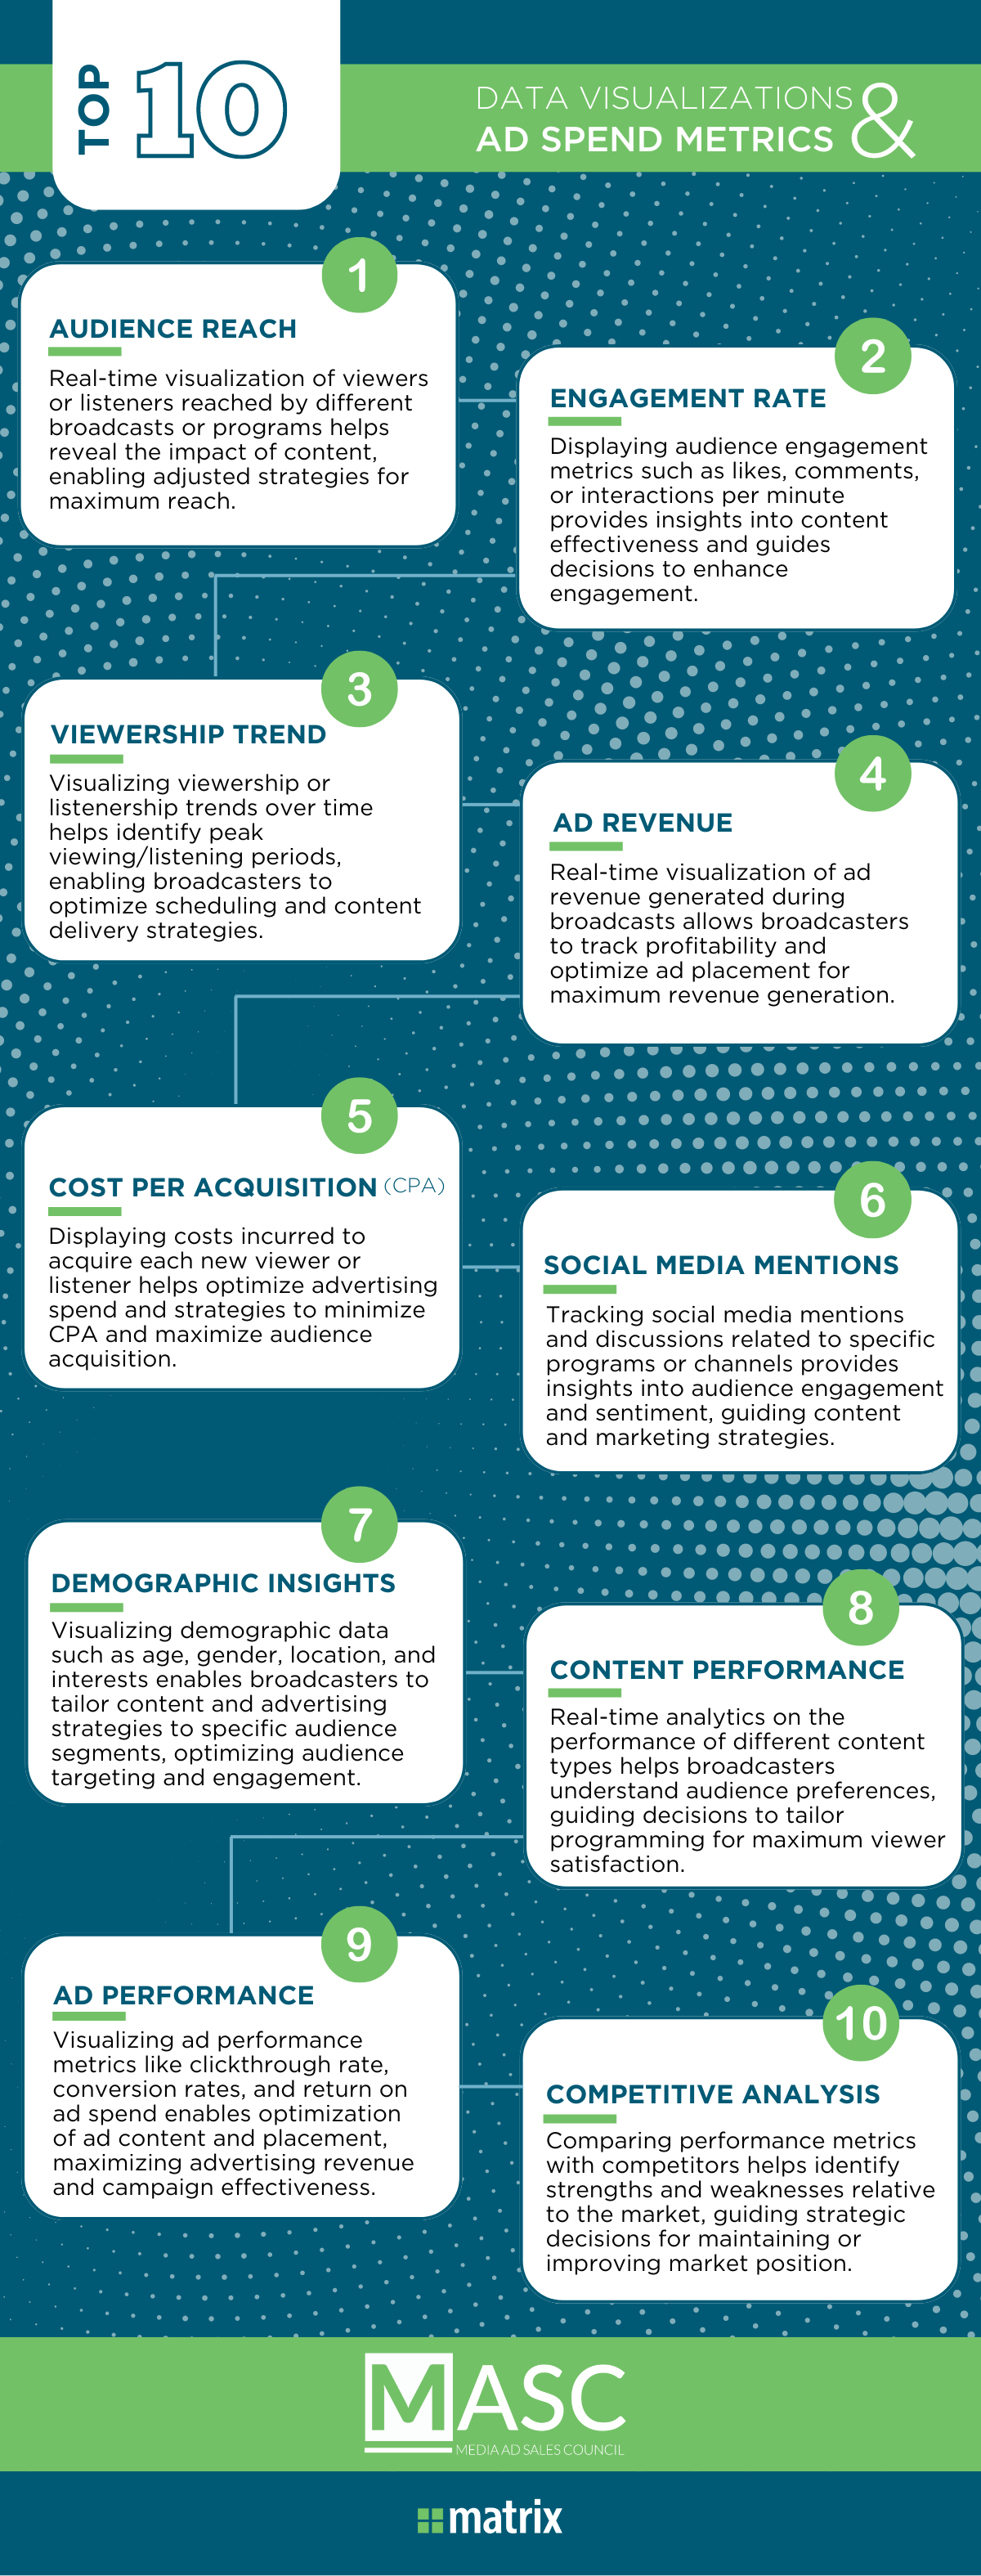
Broadcasters can leverage the following ten data visualization and spend metrics to accomplish their goals:
- Audience Reach: Real-time visualization of viewers or listeners reached by different broadcasts or programs helps reveal the impact of content, enabling adjusted strategies for maximum reach.
- Engagement Rate: Displaying audience engagement metrics such as likes, comments, or interactions per minute provides insights into content effectiveness and guides decisions to enhance engagement.
- Viewership Trend: Visualizing viewership or listenership trends over time helps identify peak viewing/listening periods, enabling broadcasters to optimize scheduling and content delivery strategies.
- Ad Revenue: Real-time visualization of ad revenue generated during broadcasts allows broadcasters to track profitability and optimize ad placement for maximum revenue generation.
- Cost per Acquisition (CPA): Displaying costs incurred to acquire each new viewer or listener helps optimize advertising spend and strategies to minimize CPA and maximize audience acquisition.
- Social Media Mentions: Tracking social media mentions and discussions related to specific programs or channels provides insights into audience engagement and sentiment, guiding content and marketing strategies.
- Demographic Insights: Visualizing demographic data such as age, gender, location, and interests enables broadcasters to tailor content and advertising strategies to specific audience segments, optimizing audience targeting and engagement.
- Content Performance: Real-time analytics on the performance of different content types helps broadcasters understand audience preferences, guiding decisions to tailor programming for maximum viewer satisfaction.
- Ad Performance: Visualizing ad performance metrics like clickthrough rate, conversion rates, and return on ad spend enables optimization of ad content and placement, maximizing advertising revenue and campaign effectiveness.
- Competitive Analysis: Comparing performance metrics with competitors helps identify strengths and weaknesses relative to the market, guiding strategic decisions for maintaining or improving market position.
While data visualization offers significant benefits to local television broadcasters, it also presents a few challenges and considerations. Broadcasters should be aware of data privacy concerns, data integration issues, visualization design considerations, and the need for ongoing training and skill development among staff.
As technology advances and consumer preferences evolve, the role of data visualization in local television broadcasting will likely become more critical. Future directions may include the integration of artificial intelligence and machine learning algorithms to automate data analysis and generate actionable insights in real-time. Broadcasters may want to evaluate how current and prospective technology partners are integrating advanced visualization toolsets into their offerings, as well as the need to develop proprietary visualizations via internal means.
Author: Media Ad Sales Council (MASC) founded by Mark Gorman, CEO, Matrix Solutions and Brenda Hetrick, President, Matrix Solutions and consisting of members: Becky Meyer, SVP, National Sales, Gray Television, Peter Jones, Head of Local Sales, Premion, Joe Lampert, Practice Lead, OmniMedia Solutions Group, Michael Barbetta, Senior Director, Revenue & Strategy, E.W. Scripps, Al Lustgarten, Media Industry Consultant and former SVP, Technology, Hearst Television, Michael Spiesman, VP Sales & Marketing, Allen Media Broadcasting, Debbie Presser, VP, National Sales, Nexstar Media Group, and Jennifer Donohue, SVP Local, Disney Advertising.
Posted at MediaVillage through the Thought Leadership self-publishing platform.
Click the social buttons to share this story with colleagues and friends.
The opinions expressed here are the author's views and do not necessarily represent the views of MediaVillage.org/MyersBizNet.