Getting ROI Right
Marketers are increasingly concerned about getting outcomes right. This is a very healthy thing. It is evidence that practitioners are taking more seriously the importance of using the right data and the right algorithms, and having focus on the right Key Performance Indicators (KPIs).
The balancing of long term brand strength versus current sales has never been easy, and historically the dominant KPI of the 20th Century was brand persuasion measures; related to a quasi-religious belief that the sales produced by advertising would never be measurable (except for direct response).
I contributed to the swing to measuring ad-produced sales when I co-founded TRA in 2005 and especially in the years that followed in which many companies copied TRA’s use of big data convenience samples to effectively bring multiple regression analysis down from markets (as in Marketing Mix Modeling, aka “MMM”) to households. Digital with its interactivity was all much more readable than one-way media, and so thousands of practitioners became able to read sales effects at varying levels of accuracy.
The most serious inaccuracy comes from not measuring all stimuli. Whatever stimuli you leave out of an analysis – their effects get credited to the stimuli you are measuring. So when a major digital platform says they got you an ROAS of $33, they are taking credit for every other tactic you were also using at the same time you were using their platform. One of my clients showed me the results of a campaign as reported by such a platform vs. as reported by one of the top MMM+big data matching measurers (who had been given all the stimuli data by the client, including price, promotion, all media, and all other variables which could have affected sales). Where the platform had attributed over $33 ROAS to themselves, MMM+big data showed that platform had an ROAS of $0.21. Simply because of including all stimuli.
The marketplace has in the past few years become aware of this to the degree that there is a swing back to MMM but not necessarily away from the big data convenience samples, with leading players combining both. I will have the honor of presenting much more information on this latest trend at the CIMM Summit on October 10-11, 2023, and hope you can attend in person (will not be available virtually).
Probability Samples More Accurate Than Convenience Samples
Back in the Mad Men era, the U.S. was a little different from Europe in terms of emphasis on probability samples. Back then many European researchers felt that quota samples could do the job as well as probability samples, whereas in America the marketing and media intelligentsia had always believed probability samples to be more accurate. However, no one was ever able to show me evidence to uphold that preference for probability samples.
Now, the prestigious Pew Research Center has published an important study comparing probability panels with non-probability panels, consistently finding much closer agreement with government benchmarks in the probability samples than in the non-probability samples, as can be seen from this table:
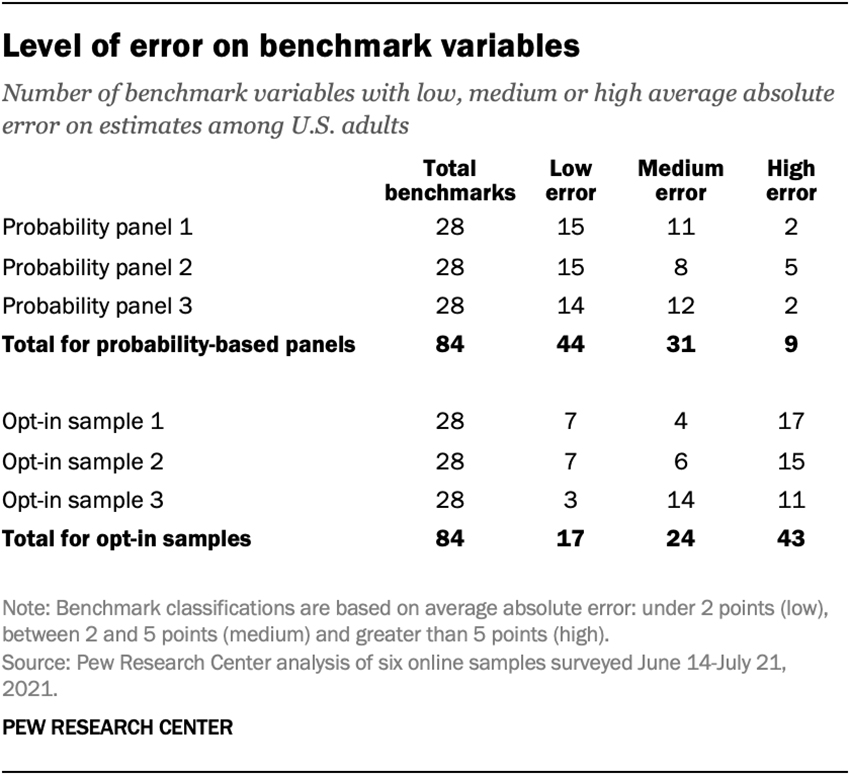
The large differences in accuracy jump out at you in this graph:
Pew researchers noted that despite sophisticated weighting techniques they could not get the non-probability results to look more like the probability results. This is because (in my opinion) the number of different human psychological characteristics, while not infinite, is a very large (and unknown) number, and only a relative handful of these characteristics have been measured at scale to the degree necessary for use as weighting variables. At TRA we weighted by 104 characteristics and managed to achieve a high correlation with Nielsen ratings (0.9533), nevertheless the specific audience projections we made were far off Nielsen numbers, causing us to limit ourselves to being a measurer of outcomes and of audience skews to fact-based purchaser targets, but not claiming to be accurate enough for use as a ratings currency.
This Pew study is a landmark in marketing research. It fully confirms the World Federation of Advertisers (WFA) and Association of National Advertisers (ANA) in their North Star requirements document for cross-platform audience measurement, which requires a probability panel to calibrate big data. This requirement was echoed from the main stage of the April 2023 Advertising Research Foundation (ARF) AUDIENCExSCIENCE conference by ANA Executive Vice President Measurement Jackson Bazley, who emphasized the absolute requirement demanded by advertisers for probability sample calibration of big data, and auditing by MRC specifically.
All six samples measured by Pew in this study are online panels, three based on probability samples and three not based on probability samples. If there are still people around the world who didn’t believe they needed probability samples for greater accuracy, I would now expect that group to largely change their minds.
The U.S. national Nielsen peoplemeter panel is an area probability sample, which is the highest form of probability sample, superior to probability samples based on random digit dialing, telephone number lists, or other device listings. The other probability sample approaches are still better than non-probability samples. The accuracy leakage in the non-area probability samples has to do with their lack of completeness. Being a spatial approach tied to the empirical world, rather than a black box listing, is the virtue of area probability designs.
The probability samples used in the Pew study were all address-based, which is one form of area probability sample. The address-based approach in all three cases utilized the U.S. Postal Service’s Delivery Sequence File, which is estimated by Pew to itself be only 90%-98% complete. The Nielsen gold standard area probability sample involved Nielsen re-enumeration of all households within primary sampling points, which is presumed to be slightly better than the use of post office files.
Pew does not report the response rates of the non-probability samples, possibly because users of non-probability samples rarely keep track of response rates. For the three probability samples analyzed in this study, Pew reports that their response rates against original predesignated samples were 1.4%, 3%, and 7%. By comparison, MRC reports that the Nielsen national U.S. TV panel response rate against original predesignated sample is ~30%.
Accuracy is expensive. Most of the nations on Earth, rich or poor, continue to invest billions and trillions of dollars collectively to make weapons more accurate. What good is a weapon if it is not accurate? What good is marketing if it is based on data that is not accurate?
Posted at MediaVillage through the Thought Leadership self-publishing platform.
Click the social buttons to share this story with colleagues and friends.
The opinions expressed here are the author's views and do not necessarily represent the views of