Nielsen ONE Ads Enables Deeper Thinking About Reach, Outcomes, and ICPM

Readers may recall my consulting relationship with Nielsen which has provided me with access to data I’ve shared with you in this column before. In this article for example we saw that Nielsen ONE finds that the topping-off point in reach is far lower in CTV, Mobile, and Computer, as compared to linear.
My efforts (and those of Tanner Goranson, Renee Kaufman, and Meghan Beeman of Nielsen) for the past few months have focused on breaking down “CTV” into its significant parts. This required a massive categorization process involving a great many publishers and platforms. As a first step we have now coded all digital video into the part that comes from the traditional network television industry versus all other online video ad inventory of all kinds. We have settled on the nomenclature of NTD (Network Television Digital) and OLV (all other Online Video).
This may not be exactly the same as what VAB calls “premium” and “non-premium” but it is directionally similar. My initial reason for seeking this granularity is to see what difference it might make to reach. After that I’ll be interested in seeing how these media types NTD and OLV perform in terms of outcomes. Watch this space.
Nielsen ONE Ads contains over 45,000 campaigns, a number that is growing every month. For this study, I selected a random sample of 229 campaigns. As I began to look through the fascinating Nielsen ONE Ads data, what popped out first was that I noticed a small percentage of campaigns consist of 85% or more of OLV. The highest reach attained is 17.2% with 133 GRPs against the target. More typically across these 130-140 GRP campaigns which generally use quite a bit more NTD than OLV, 133 GRPs would get you ~23.8% reach. So, no surprise, counting on a single form of video for your advertising is not the way to go in the 21st Century.
My eye was drawn to other small schedules once I was looking at OLV-dominant campaigns. I saw what looked like an informative pattern and extracted the following graph:
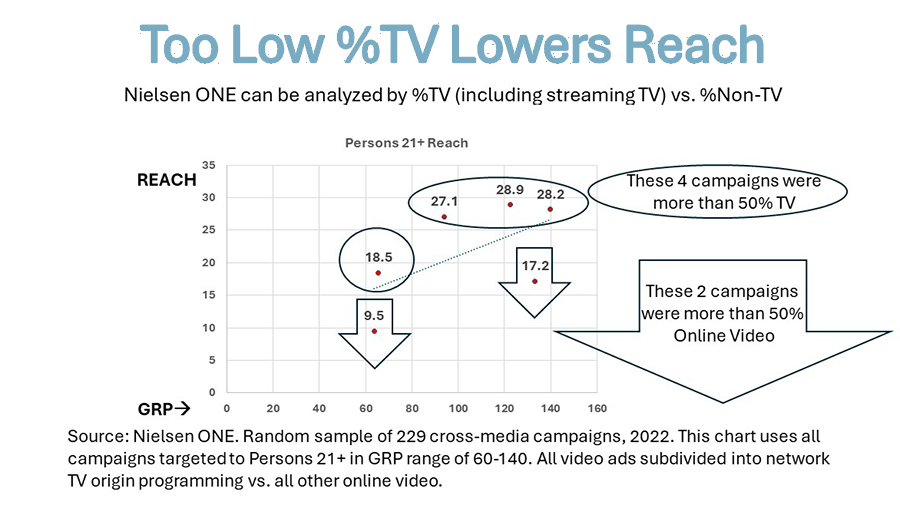
What this reminds us is that in the small end of things, linear plus NTD is vitally important in maximizing reach. It’s only when reach has gone over around 50% that the best optimizers begin to gradually switch to a mix of TV+NTD with OLV (including influencers), radio, display, print, outdoor, experiential, cinema, and other media/marketing types.
On the way up from 20-50% reach, the same optimizers leaven in some of these other media types to hasten the arrival at 50%, but TV+NTD are the most essential.
Quite a few advertisers have switched over to the new media a bit faster than can be empirically defended. Some have notched back. The over-investment in digital is however still gigantic and has societal impact. It is too soon to pin down the percentage, but my guess is that 20-30% of what is now in digital ought to be in TV+NTD. This is based largely on my experience at TRA and the FOX BHC ROAS study which is having its tenth birthday this year. It is the largest MMM study I know of, covering over $3 trillion in sales and over $50 billion in ad investments, in product categories representing more than half of total national TV spend. CIMM recently published my report containing excerpts of the latter findings showing that digital is overspent and saturated for big national advertisers.
Attention data, including from a landmark Meta study in which I participated with Realeyes and Eye Square, is accumulating which shows that the streaming video experience provides more attention than short-form videos (YouTube, etc.) and much more than feed (the scrolling experience, e.g. Facebook). Those outcome considerations are even more important than reach, but neither can be sacrificed. The unadjusted CPM is a thing of the past. ICPM is here today. Impact CPM: CPM weighted by the supposed (best guess or best data) impact of that media type. I introduced that idea to IPG and Grey in my first two years in the business. Mike Drexler was another pioneer of ICPM, and there were hundreds of us, and today thousands. Time to make the switch in thinking to ICPM. It’s simple and you wind up incentivizing and therefore maximizing real business success, rather than an abstract impressions-based set of achievements.
Coming back to Nielsen ONE Ads findings, I had reported that Marc Pritchard laid out a manifesto for marketing in which the brand would aim to get 90% reach of each of its target segments, which I continue to endorse, that 90% reach to be across a time period equal to the average purchase cycle for the advertised brand.
So, what does it take to get 90% reach nowadays? In my random sample of 229 campaigns, only 2 made it to that bar. Here’s what made it happen:
Number one is scale:
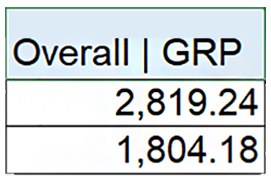
That’s what it’s going to cost you per purchase cycle to maintain that 90% reach per purchase cycle.
My guess is the use of the best possible optimizer would potentially cut that in half, once Nielsen and the other audience measurement companies carry out their respective plans. We have to be patient as that retooling goes on because it will be a firm foundation for the rest of the century in marketing.
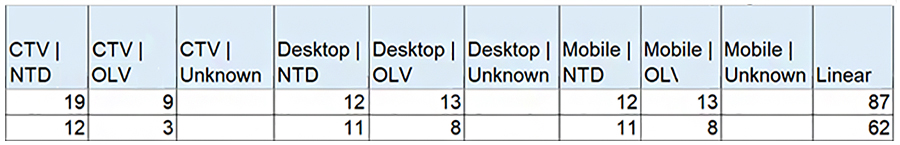
Number two: a highly dispersed campaign, and number three, preponderance of NTD over OLV.
115 and 165 networks/platforms respectively for Brands A and B across TV sets, computers, tablets, and phones. A lot of separate business deals. A lot of thinking time. Here is the breakdown of the number of deals for the two brands. Note Brand A made 19 NTD deals and 9 OLV deals for CTV, Brand B was similar but not as widely dispersed.
Just to remind ourselves that we’re looking at the pinnacle of reach accomplishment in my random sample, brands who have hit the Pritchard mark.
Takeaways:
- Linear is good, NTD is good
- Other digital is overspent
- Patience and support are due to the measurers preparing to be more perfect for this complex new world
Posted at MediaVillage through the Thought Leadership self-publishing platform.
Click the social buttons to share this story with colleagues and friends.
The opinions expressed here are the author's views and do not necessarily represent the views of MediaVillage.org/MyersBizNet.

Bill Harvey
Bill Harvey, who won an Emmy® Award in 2022 for his invention of set top box data, has spent over 35 years leading the way in media research with pioneer thinking in New Media, set top box data, optimizers, measurement standards, privacy standards, the A…